This is a session dedicated to multivariate data visualization using some tipical feature of automobile. Here below we can see the matrix of correlation between features and a graphical representation.
       mpg   cyl  disp    hp  drat    wt  qsec    vs    am  gear  carb
mpg   1.00 -0.85 -0.85 -0.78  0.68 -0.87  0.42  0.66  0.60  0.48 -0.55
cyl  -0.85  1.00  0.90  0.83 -0.70  0.78 -0.59 -0.81 -0.52 -0.49  0.53
disp -0.85  0.90  1.00  0.79 -0.71  0.89 -0.43 -0.71 -0.59 -0.56  0.39
hp   -0.78  0.83  0.79  1.00 -0.45  0.66 -0.71 -0.72 -0.24 -0.13  0.75
drat  0.68 -0.70 -0.71 -0.45  1.00 -0.71  0.09  0.44  0.71  0.70 -0.09
wt   -0.87  0.78  0.89  0.66 -0.71  1.00 -0.17 -0.55 -0.69 -0.58  0.43
qsec  0.42 -0.59 -0.43 -0.71  0.09 -0.17  1.00  0.74 -0.23 -0.21 -0.66
vs    0.66 -0.81 -0.71 -0.72  0.44 -0.55  0.74  1.00  0.17  0.21 -0.57
am    0.60 -0.52 -0.59 -0.24  0.71 -0.69 -0.23  0.17  1.00  0.79  0.06
gear  0.48 -0.49 -0.56 -0.13  0.70 -0.58 -0.21  0.21  0.79  1.00  0.27
carb -0.55  0.53  0.39  0.75 -0.09  0.43 -0.66 -0.57  0.06  0.27  1.00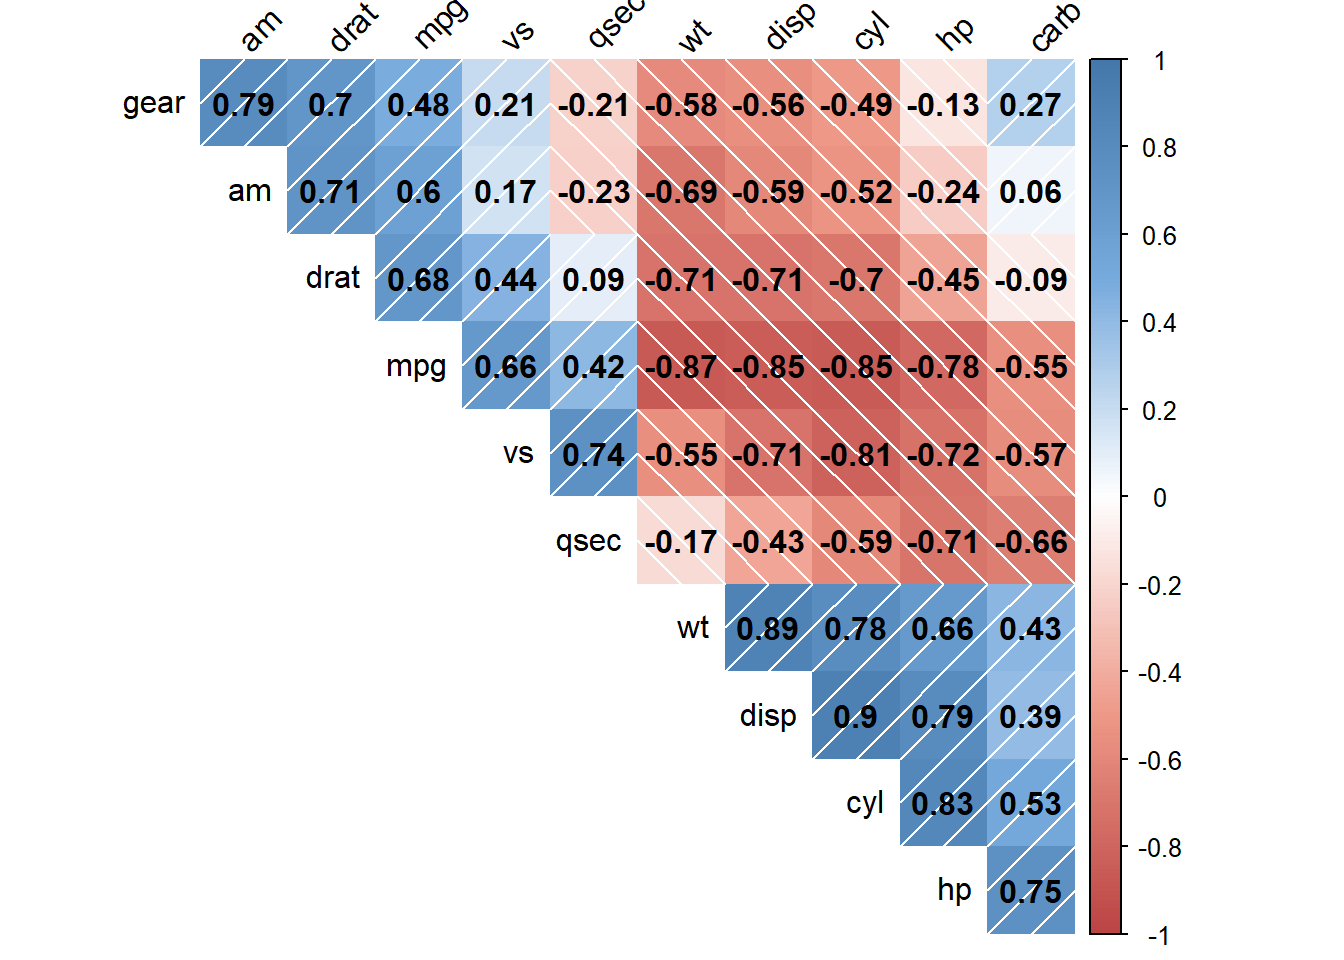
The graph below is generated using ggplot2, and gives us a great view of the relationship of our features. We have the density function of miles per gallon (mpg). Cylindres is a categorical variable and so is represented by an histogram. Cylindres vs. mpg gives us the fuel consumption per number of cylindres using the box-plot representation on the upper part of the graph, and in the lower partwe can appreciate the distributoìion. And in the cases where we have both variables continues the graph give back upper the density level and lower the graph of the relationship (e.g. displacement vs. mpg).
library(GGally)
ggpairs(auto[,2:5],
        aes(color = cylinders,
            alpha = 0.4),
        upper= list(continuous = "density"),
        lower = list("denstrip"))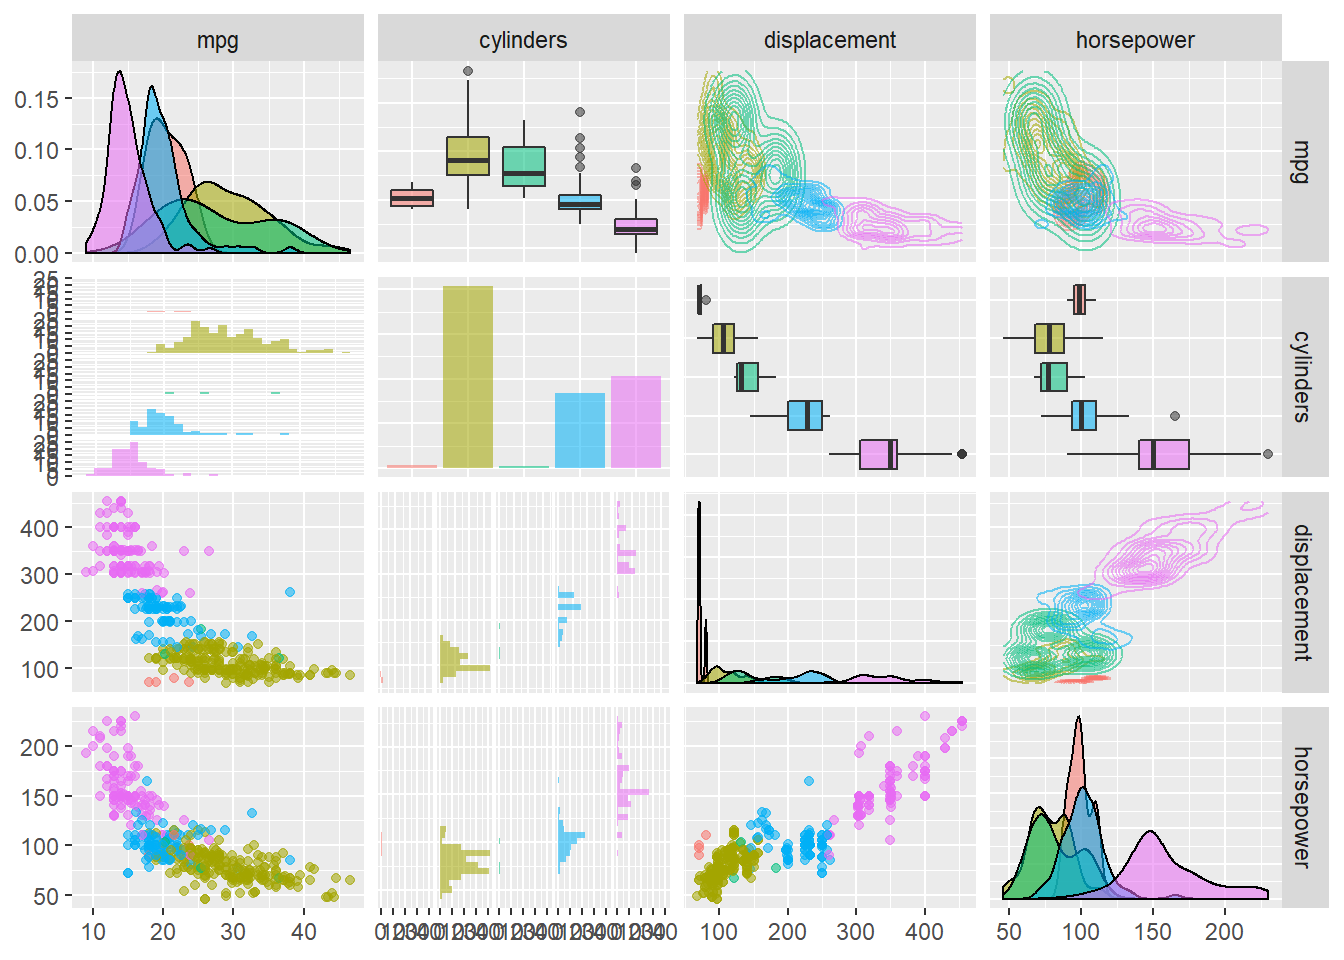
We can alo see in different color, the correlatin by the different category of cylindres. We have summarized in a single plot the different functions of density per cylindres, the histograms per category of cylindre, the correlation between continuous variables and the diagram of density. It is a completexploratory analysis.