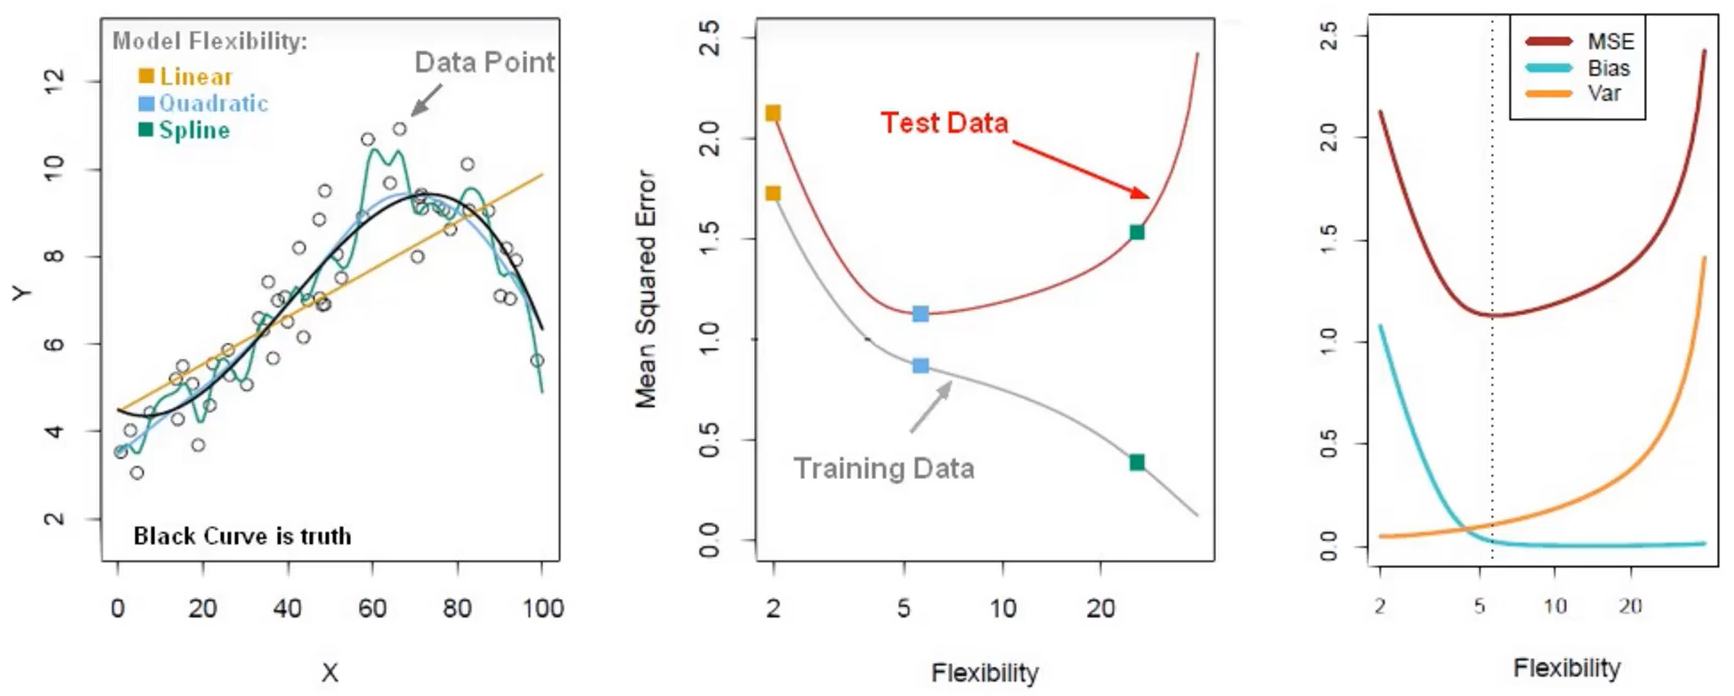
The Bias Variance Trade-Off is used to understand the model’s performance and evaluation. We we have a training error that goes down, nut test error starting to go up, the model we created begins to overfit.
Image to have a Linear Regression ML, but is not accurate to replicate the curve of the true relationship between height and weight. The inability for an ML to capture the true relationship is called bias. Now, another ML might fit a Squiggly Line to the training set, which is super-flexible to fit the training-set. But, when we calculate the Sum of the Squared Error in the Test-set, we probably find that the Linear Line is better than the Squiggly Line, and we call this overfitting. In ML Lingo, the difference in fitting between Training and Testing is called variance.

The most left graph in the figure above describes a model flexibility as a linear, quadratic and spline fit. In order to compare our models each other we have to do is to plot out the flexibility versus the Mean Squared Error as explained in the middle graph above. The graph plot out the training data vs. the test data. We can see that we have high error for the linear model (in yellow). The error goes down for the quadratic model (in blue), The error stars to increase again for the spline model (in green), but crucially only in the test set, meanwhile for training set the error continues to decrease: this condition is called overfitting.

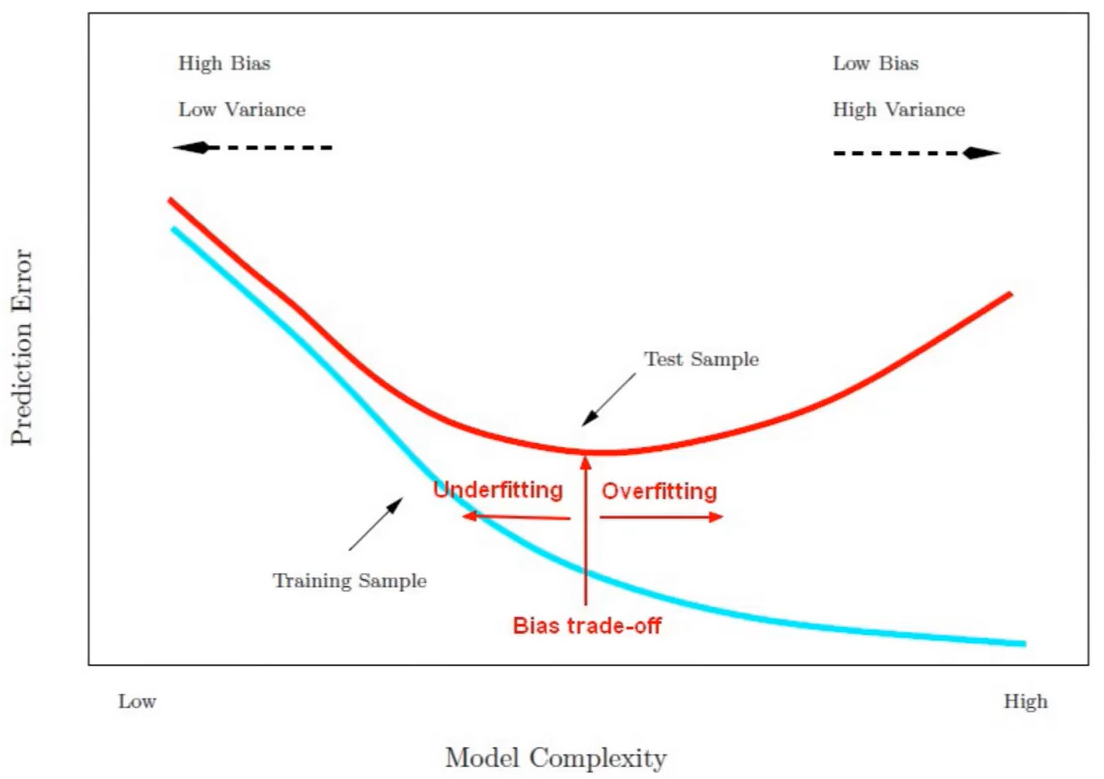
The figure above shows the prediction error as a function of model complexity. As we move to the left, we have high bias but low variance = underfit the data. As we move to the right where there is a higher complexity, we get a lower bias but high variance = overfit the data.